
One of the most common questions asked about the Anchor and Leveraged Anchor strategies relates to “what’s the most I can lose on the trade.” Fortunately, that’s a fairly easy number to calculate for any one given time on a known portfolio. A yearlong dynamic calculation is a bit more difficult.
Below is a presentation of both calculations. Note this is a discussion on the current portfolio. Actual losses in new or differently structured portfolios may vary dramatically.
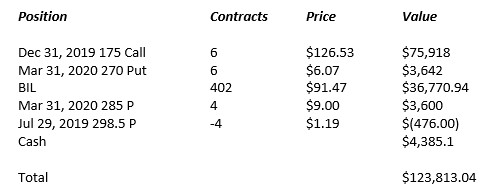
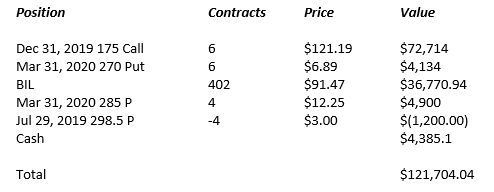
The current Leveraged Anchor portfolio looks like (as of July 15, 2019):
Before we continue, lets take a look at the model we posted in our Leveraged Anchor Implementation article when we just started the Leveraged Anchor implementation:
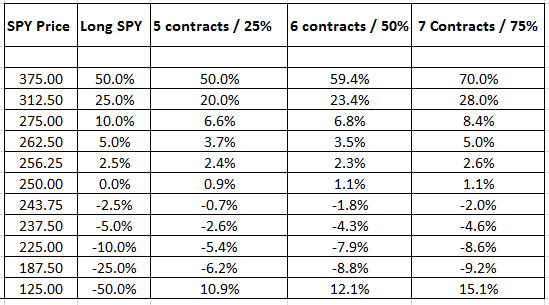
The current implementation is using 50% leverage.
SPY was up around 20% YTD on July 15, 2019. Based on the table, the Anchor was expected to slightly lag (1-2%). In reality, it produced 23.8% return, actually outperforming the markets
Now, lets look at the maximum loss. It is going to occur at some point after the long call is worth zero. Hypothetically, that would occur Dec 31 when there is zero time value left in the long calls. Let’s say there’s a catastrophic September 11 type event, and the markets open on December 31 at SPY 175. We picked 175 because that’s the “worst case” ending price of SPY. If it continues to go down after that point, our long puts become more
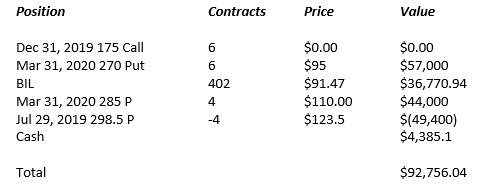
Our starting investment of the year was $100,000. In the event that the market declines 41% from its current position (30% from the start of the year price), the Leveraged Anchor portfolio would be down 7.5% on the year
For those who want to see what a bigger crash would look (as opposed to just trusting that bigger crashes are better), below assumes a price of SPY 100 on December 31:
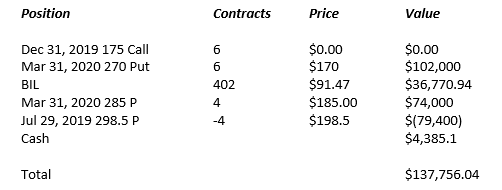
As noted earlier, the farther the market drops below 175, the better the Leveraged Anchor will perform. If the market dropped 60% YTD, Anchor would be up 37.7%.if we make no more tradesworst case scenario of the year is down 7.5%
However
Take the following example which assumes that on July 29, the market is at SPY 295.5 – only slightly below our present price of around 298.5 (prices were derived using CBOE’s option calculator):
Due to the small decline in SPY, a loss on the short puts would be realized, but the benefit of the long puts has not really kicked in. This can easily continue until SPY gets to the 270 range. If the market follows a down trending pattern which looks like:
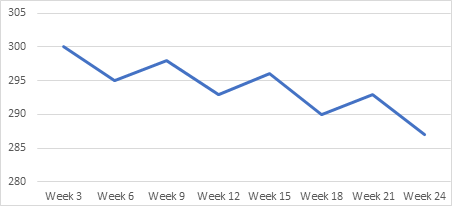
then we end up with the true worst case scenario, as not only have the long calls lost value, but we have lost value rolling the short puts every three weeks. Note to reach this worst case scenario, there is a price decline over 3 weeks, so we fully realize the loss on the sort puts, but then there’s a market rebound leading to a sale of a put at a higher level (that is not quite as high as the original price), followed by another 3 week decline. Both Leveraged Anchor and Anchor suffer the most when there is a 3 week market decline, followed by a rebound back up, followed by a three week decline, and this pattern continues for an extended time. This can lead to the bleeding of a few thousand dollars each roll period.
If you assume that style of decline over the entire year leading up to the long call expiration (7 more three week periods), it would be possible to lose another $20,000 or so, just depending on the angle of descent of the market decline – the shallower the decline, the worse off Anchor would be. This is part of the reason why Leveraged Anchor has the short puts hedged at the money, while the long calls are hedged five percent out of the money. By hedging the short puts at the money, we reduce the potential drawdowns from a slow decline pattern.
Of course, in the history of the stock market, the above charted pattern has never declined in that orderly of a fashion for a six month period, much less an entire year. It’s much more frequent to have sharper declines, rebounds back above the original price, flat periods, etc.. The chance of going down then back up almost to the starting point, then back down – all on exact 3 week cycles, isn’t likely, but it could happen
In this worst case, performance of the Anchor strategy will be the worst in a market with an extended pattern as graphed above until the hedge kicks in. This result would be worse than the 7.5% “one day” catastrophic worst case loss scenario.
In our opinion, the “worst” loss someone should expect in the current portfolio is somewhere around a 15% decline from the starting $100,000 investment. That would require significant “stair stepping” down, in three-week cycles, and the price of SPY ending up right at 175 in December. That is an awfully specific set of conditions that has to be met to reach that point, but it certainly couldis not
Remember, the above is a “worst case” analysis – which Anchor is certainly designed to combat and provide better alternatives than simply being in the market. The above analysis shows Anchor will still significantly
Personally, I greatly appreciate the tradeoff in a catastrophic event or even in sharp downturns. But I also understand the risks, worst case scenarios, and the market conditions which damage the trade the most. Anyone trading the strategy should have such an understanding.
If you would like to give it a try, you can sign up here.
Christopher Welsh is a licensed investment advisor and president of LorintineCapital, LPCERTIFIED FINANCIAL PLANNER™ Anchor Trades
What Is SteadyOptions?
Full Trading Plan
Complete Portfolio Approach
Diversified Options Strategies
Exclusive Community Forum
Steady And Consistent Gains
High Quality Education
Risk Management, Portfolio Size
Performance based on real fills
Non-directional Options Strategies
10-15 trade Ideas Per Month
Targets 5-7% Monthly Net Return
Recent Articles
Articles
Pricing Models and Volatility Problems
Most traders are aware of the volatility-related problem with the best-known option pricing model, Black-Scholes. The assumption under this model is that volatility remains constant over the entire remaining life of the option.
By Michael C. Thomsett, August 16

- Added byMichael C. Thomsett
- August 16
Option Arbitrage Risks
Options traders dealing in arbitrage might not appreciate the forms of risk they face. The typical arbitrage position is found in synthetic long or short stock. In these positions, the combined options act exactly like the underlying. This creates the arbitrage.
By Michael C. Thomsett, August 7
- Added byMichael C. Thomsett
- August 7
Why Haven't You Started Investing Yet?
You are probably aware that investment opportunities are great for building wealth. Whether you opt for stocks and shares, precious metals, forex trading, or something else besides, you could afford yourself financial freedom. But if you haven't dipped your toes into the world of investing yet, we have to ask ourselves why.
By Kim, August 7

- Added byKim
- August 7
Historical Drawdowns for Global Equity Portfolios
Globally diversified equity portfolios typically hold thousands of stocks across dozens of countries. This degree of diversification minimizes the risk of a single company, country, or sector. Because of this diversification, investors should be cautious about confusing temporary declines with permanent loss of capital like with single stocks.
By Jesse, August 6

- Added byJesse
- August 6
Types of Volatility
Are most options traders aware of five different types of volatility? Probably not. Most only deal with two types, historical and implied. All five types (historical, implied, future, forecast and seasonal), deserve some explanation and study.
By Michael C. Thomsett, August 1
- Added byMichael C. Thomsett
- August 1
The Performance Gap Between Large Growth and Small Value Stocks
Academic research suggests there are differences in expected returns among stocks over the long-term. Small companies with low fundamental valuations (Small Cap Value) have higher expected returns than big companies with high valuations (Large Cap Growth).
By Jesse, July 21
- Added byJesse
- July 21
How New Traders Can Use Trade Psychology To Succeed
People have been trying to figure out just what makes humans tick for hundreds of years. In some respects, we’ve come a long way, in others, we’ve barely scratched the surface. Like it or not, many industries take advantage of this knowledge to influence our behaviour and buying patterns.
- Added byKim
- July 21
A Reliable Reversal Signal
Options traders struggle constantly with the quest for reliable
By Michael C. Thomsett, July 20
- Added byMichael C. Thomsett
- July 20
Premium at Risk
Should options traders consider “premium at risk” when entering strategies? Most traders focus on calculated maximum profit or loss and breakeven price levels. But inefficiencies in option behavior, especially when close to expiration, make these basic calculations limited in value, and at times misleading.
By Michael C. Thomsett, July 13
- Added byMichael C. Thomsett
- July 13
Diversified Leveraged Anchor Performance
In our continued efforts to improve the Anchor strategy, in April of this year we began tracking a Diversified Leveraged Anchor strategy, under the theory that, over time, a diversified portfolio performs better than an undiversified portfolio in numerous metrics. Not only does overall performance tend to increase, but volatility and drawdowns tend to decrease:
Saturday, February 8, 2020