
Options traders struggle constantly with the quest for reliable
The crossover is between the middle band an d price.
The default setting for Bollinger Bands is two standard deviations. When this default is applied, three bands appear. The upper and lower bands are the same dist ance from the middle band, because their application of standard deviation is always the same. Bollinger Bands is so reliable that with this default setting, you see violations above upper or below lower bands only rarely. And once violated price tends to retreat into range within a few sessions.
A problem with Bollinger Bands is that once the move of price outside of the banded range is seen, it usually is too late to act. You expect to see a retreat soon, but the status of price outside the bands can persist for many sessions when a strong trend is underway.
There is a solution, however.
If you adjust the default and remove the two standard deviations, replacing it with three, you set up a very unusual situation. Price almost never moves above the upper band or below the lower band when three standard deviations are in use. In fact, a review of most charts and most durations shows that it is very rare to see such a move. However, when price does move outside of three standard deviations, it sets up an exceptional entry signal. The violation of three standard deviations inevitably reverses within one to two sessions in most cases. This is a signal of likely price movement in the opposite direction (bullish after a violation of the lower band, or bearish after violation of the upper band). When you see a violation on the lower side, you can act right away – buy calls or sell puts in anticipation of a bullish reaction.
An example is seen in the 6-month chart of Home Depot Two violations of three standard deviation are highlighted in March. By March 23, price has declined about 100 points in one only month. For many traders in either options or stock, this big decline means you want to stay away from the underlying. It could signal a massive bearish move that could continue indefinitely. However, considering the brief moves below the lower band, the likelihood of bullish reversal is among the strongest you can find. But when should the entry occur?
In this example, three bullish candlestick reversal signals identify the bottom of the downtrend. It is very unusual to see two consecutive and strong reversal signals. At the very bottom of the trend, you see a bullish engulfing immediately followed by a bullish piercing lines. Those two are strong just by themselves. But there also is a gap immediately before these signals and then immediately after in the opposite direction. This sets up the four lowest sessions as an island cluster, which by itself is a strong bullish reversal signal.
The combination of the two violations of the lower band set up with three standard deviations, the bullish engulfing, the bullish piercing lines, and the island cluster is one of the strongest bullish reversals you will ever see.
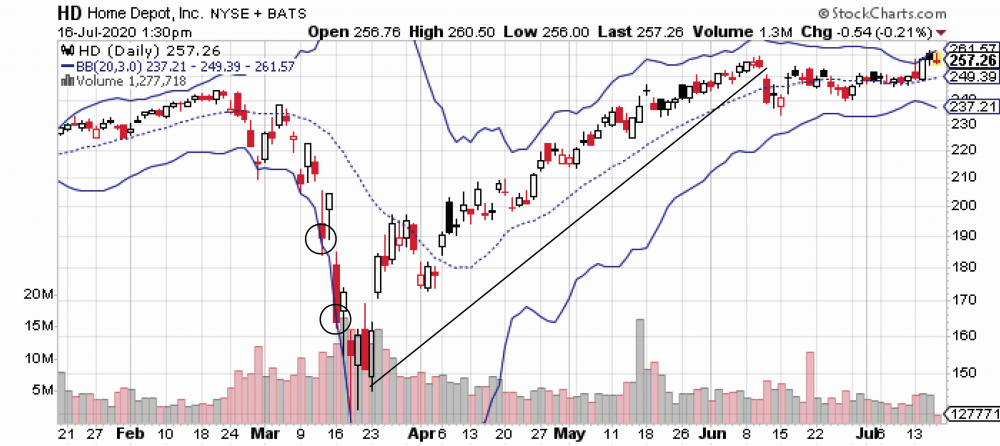
The next question remains, when should you exit from the position. Note the trendline drawn from the bottom of the March decline, all the way through to mid-June. This is a strong 3-month bullish trend. During this time, the underlying price rose from around a low of $140 per share, up to about $260 per share.
There is an exit signal here as well, which often is found on charts using Bollinger Bands. Note the behavior of the middle band, the dotted line. It tracks the trendline consistently, until the first week of June, when it crosses over the trendline and moves to the downside. This is a strong signal that the trend is about to either reverse or flatten. By mid-June, a small decline takes place and then underlying price moves sideways. The middle band crossover is the exit signal. Altogether, this simple set of patterns and signals provides a compelling case for identifying option entry and exit.
If an options trader already holds shares of an underlying, it is possible that a 3-standard deviation violation will never be found or will occur only rarely and during periods of extreme price movement. But for the options trader who is not in an equity position and is looking for opportunities to make strong options trades (long calls or short puts, for example), the observation of the 3-standard deviation opportunity is difficult to ignore.
The question remains: Which issues work best for this type of timing strategy? A low-volatility underlying will not be likely to ever exhibit a violation of the three standard deviations. This is a strategy designed for higher-volatility issues, where the 3-standard deviation moves are more likely to occur. This is a higher-risk selection for options traders, but the opportunity to set up trades with high degree of reliability, is compelling and may offset the higher than average historical and implied volatility. Many options traders gravitate toward these higher-risk underlying issues anyhow, because the option premium tends to be richer and chances for larger profits are also better.
This strategy employing three standard deviations, candlestick reversals, and center band crossover, takes the high risk of the volatile underlying, and overlays a high degree of certainty. Although no trade is 100% certain, this example lowers the greater risk that plagues options traders, the risk of (a) poor entry timing and (b) failure to exit when the trend ends. Both risks are well managed in the strategy employing all the required elements.
Michael C. Thomsett is a widely published author with over 80 business and investing books, including the best-selling Getting Started in Options, coming out in its 10th edition later this year. He also wrote the recently released The Mathematics of Options. Thomsett is a frequent speaker at trade shows and blogs on his website at Thomsett Publishing as well as on Seeking Alpha, LinkedIn, Twitter and Facebook.
What Is SteadyOptions?
Full Trading Plan
Complete Portfolio Approach
Diversified Options Strategies
Exclusive Community Forum
Steady And Consistent Gains
High Quality Education
Risk Management, Portfolio Size
Performance based on real fills
Non-directional Options Strategies
10-15 trade Ideas Per Month
Targets 5-7% Monthly Net Return
Recent Articles
Articles
Pricing Models and Volatility Problems
Most traders are aware of the volatility-related problem with the best-known option pricing model, Black-Scholes. The assumption under this model is that volatility remains constant over the entire remaining life of the option.
By Michael C. Thomsett, August 16

- Added byMichael C. Thomsett
- August 16
Option Arbitrage Risks
Options traders dealing in arbitrage might not appreciate the forms of risk they face. The typical arbitrage position is found in synthetic long or short stock. In these positions, the combined options act exactly like the underlying. This creates the arbitrage.
By Michael C. Thomsett, August 7
- Added byMichael C. Thomsett
- August 7
Why Haven't You Started Investing Yet?
You are probably aware that investment opportunities are great for building wealth. Whether you opt for stocks and shares, precious metals, forex trading, or something else besides, you could afford yourself financial freedom. But if you haven't dipped your toes into the world of investing yet, we have to ask ourselves why.
By Kim, August 7

- Added byKim
- August 7
Historical Drawdowns for Global Equity Portfolios
Globally diversified equity portfolios typically hold thousands of stocks across dozens of countries. This degree of diversification minimizes the risk of a single company, country, or sector. Because of this diversification, investors should be cautious about confusing temporary declines with permanent loss of capital like with single stocks.
By Jesse, August 6

- Added byJesse
- August 6
Types of Volatility
Are most options traders aware of five different types of volatility? Probably not. Most only deal with two types, historical and implied. All five types (historical, implied, future, forecast and seasonal), deserve some explanation and study.
By Michael C. Thomsett, August 1
- Added byMichael C. Thomsett
- August 1
The Performance Gap Between Large Growth and Small Value Stocks
Academic research suggests there are differences in expected returns among stocks over the long-term. Small companies with low fundamental valuations (Small Cap Value) have higher expected returns than big companies with high valuations (Large Cap Growth).
By Jesse, July 21
- Added byJesse
- July 21
How New Traders Can Use Trade Psychology To Succeed
People have been trying to figure out just what makes humans tick for hundreds of years. In some respects, we’ve come a long way, in others, we’ve barely scratched the surface. Like it or not, many industries take advantage of this knowledge to influence our behaviour and buying patterns.
- Added byKim
- July 21
A Reliable Reversal Signal
Options traders struggle constantly with the quest for reliable
By Michael C. Thomsett, July 20
- Added byMichael C. Thomsett
- July 20
Premium at Risk
Should options traders consider “premium at risk” when entering strategies? Most traders focus on calculated maximum profit or loss and breakeven price levels. But inefficiencies in option behavior, especially when close to expiration, make these basic calculations limited in value, and at times misleading.
By Michael C. Thomsett, July 13
- Added byMichael C. Thomsett
- July 13
Diversified Leveraged Anchor Performance
In our continued efforts to improve the Anchor strategy, in April of this year we began tracking a Diversified Leveraged Anchor strategy, under the theory that, over time, a diversified portfolio performs better than an undiversified portfolio in numerous metrics. Not only does overall performance tend to increase, but volatility and drawdowns tend to decrease: