
Almost all passive invest ment strategies are based on the assumption that younger investors should hold more equities as a percentage of their total portfolio. Likewise, as they age and get closer to retirement, the allocation to fixed income assets should grow while equity holdings shrink.
Target Date Funds (TDF’s), which base asset allocation solely on a specific future date, are the poster child for this strategy and demonstrate the current epitome of blind faith in passive strategies.
If such a strategy were effective, investing would be simple and we could all meet our retirement goals. Unfortunately, our investment lifespans never line up with valuation peaks and troughs. As such, any strategy that ignores expected returns and the risks associated with asset prices at each point along the investment horizon is destined for failure.
In this piece, we focus on an important graph and its construction. We illustrate that there are times, regardless of whether you are 75 or 25, that you should heavily invest in stocks and other times when bonds should take priority over stocks.
We offer a special thank you to Brett Freeze for help sourcing and compiling the data used in the graphs and tables below.
Missing the Target
Target Date Funds (TDF’s) are mutual funds that determine asset allocation and particular investments based solely on a target date. These funds are very popular offerings in retirement plans and 529 College Savings Plans due to the known date when someone wishes to retire or send a child to college.
When TDFs are newly created, with plenty of time until the target date, they allocate assets heavily towards the equity markets. As time progresses, they gradually reallocate towards government bonds and other highly-rated fixed income products.
The following charts show how Vanguard’s TDF allocations transition as the amount of time remaining until the target date declines.
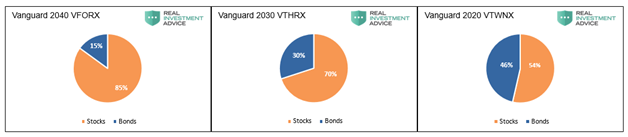
The problem with these funds is that the asset allocations employed are solely a function of a specified future date,giving no consideration to the price paid for those assets . More simply, these funds completely ignore the most basic rule of investing, buy low and sell high.
Expected Returns
To effectively explain a practical method for allocating between stocks and bonds,we have created a rather complex graph. Rather than present it now and try to explain the myriad of data points represented by the various symbols and lines, we think it is best to walk you through the construction of the graph.Viewing the various components of the graph in isolation will make iteasier to interpret and shine a light on the expected outcomes for stocks and bonds.
Valuations
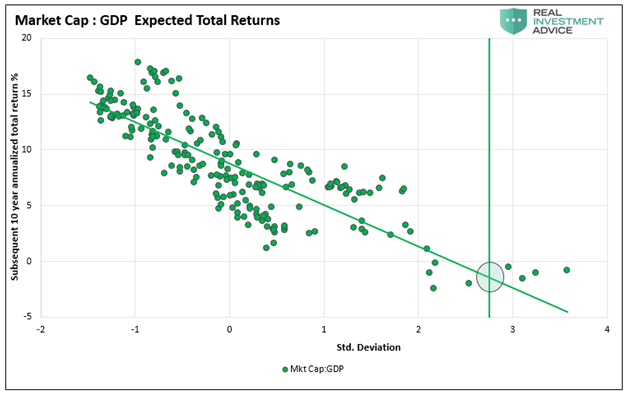
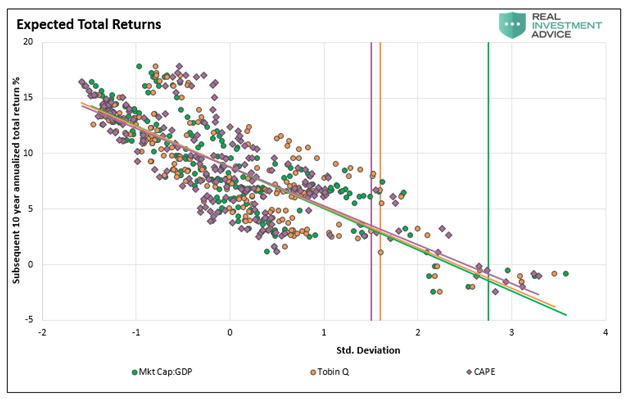
The following three graphs are scatter plots of popular equity market valuations and their associated returns. Specifically, the green, orange, and purple markers represent the intersection of a quarterly valuation level and the subsequent 10-year annualized total return . Instead of using the specific valuation data in the x-axis, we use each data point’s standard deviation from the mean. This allows us to more effectively compare the values of the three metrics together.
On each graph you will see a downward slanted line, which is the regression trend line of the markers (dots/diamonds). Each graph also has a vertical line representing the current valuation level. The intersection of these two lines is the expected return for the next ten years. The three graphs and the compilation of them shown last is based on nearly 75 years of data.
1. Market Cap to GDPis probably the best single measure of where valuations stand at any given moment
The R-squared measuring correlation stands at 0.69, meaning that 69% of ten-year forward returns can be explained by the current valuation . The ten-year annualized expected total return is -1.42% as shown by the circle surrounding the intersection of the current valuation and trend line. Also note that with the exception of one quarterly instance, anytime the ratio was greater than two standard deviations above the average, the following ten years posted a negative return.
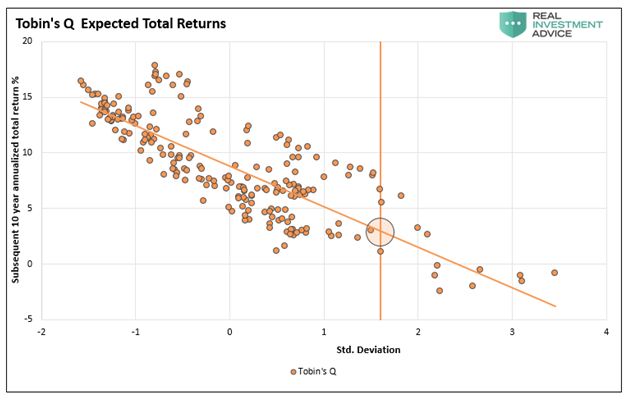
2. Tobin’s Q Ratio
The R-squared is 0.67,and the ten-year expected total annualized return is +2.92%.
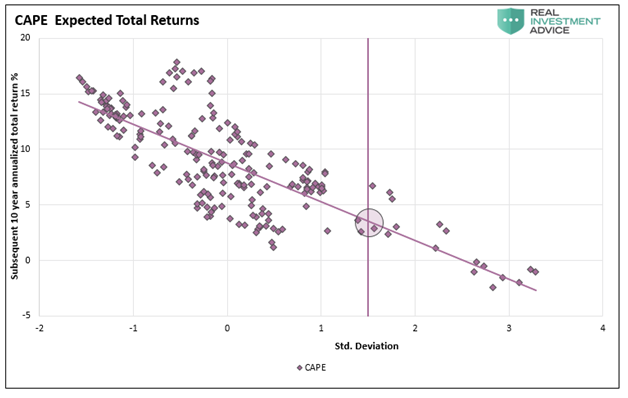
3. Robert Shiller’s CAPE
The R-squared is 0.62,and the ten-year expected total annualized return is +3.49%.
Now we compile the data from the three graphs to get a broad picture of what these valuations portend.
We find it fascinating that the trend lines and data points for three different valuation methods are so closely aligned.While each valuation measure points to a different expected return, the broad message is clear that higher valuations imply weaker future returns and vice versa. More importantly,the current valuation levels all point to poor expected returns. Factor in inflation and the returns for all three measures are likely at or below zero.
Fixed Income Alternatives
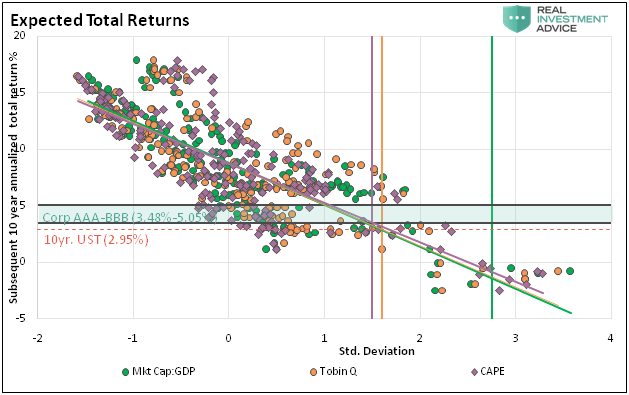
Having seen return expectations for stocks, we now shift focus to consider the potential return on other asset classes. While there are many alternative assets in which one can invest, we chose to simplify this analysis and compare equities to the yields of liquid, high-quality fixed-income securities. The primary reason is that the U.S. Treasury note and investment-grade bonds we use are easy to acquire and guarantee a fixed ten-year return barring a default. Default risk for the bonds we selected for this analysis is very low.
The following graph combines the guaranteed yields of the bonds we selected (barring default) as compared to the equity outcomes shown above. The red dotted line in the graph represents the current yield on a risk-free ten–year U.S. Treasury (2.95%), while the aqua shaded area provides a range of yields for the corporate bonds.Beneath the graph is details of the corporate bonds selected for this analysis.
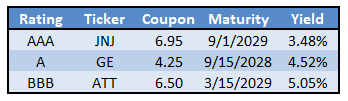
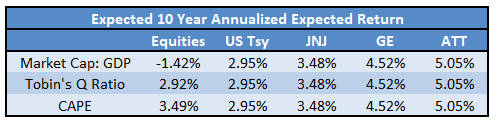
The following table compares the expected returns for equities, Treasury note, and the selected corporate bonds.
Summary
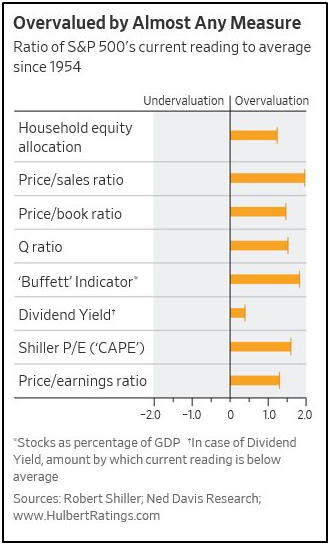
We only presented three measures of valuation in this analysis. We did not cherry pick valuations as evidenced by the table below showing our three indicators as well as five others.
For an investor who elects to continue to chase the stock market higher, do so with the understanding that the market is well overdue for a serious drawdown. If you are a passive investor and do not track day to day price changes or follow technical studies, we recommend you take this analysis seriously and formulate a plan to manage risk.
However, doing so requires some work and effort which runs counter to current investment norms. Passive investing is “easy” and requires no effort. Plus, the fees are low. In contrast, identifying times when the market is cheap or expensive requires some work and usually cuts against popular opinion. T he evidence of historical data is clear; we are all but guaranteed to achieve a better return on bonds than stocks for the next ten years. The only question we all must answer is when should we stop following the equity herd and start following the long lesson of the history books? Despite the insistence of many popular investors and the financial media, this time is not different.
As Benjamin Graham notes in his classic book The Intelligent InvestorSuccessful investing is about managing risk, not avoiding it.
Michael Lebowitz, CFA is an Investment Analyst and Portfolio Manager for Clarity Financial, LLC specializing in macroeconomic research, valuations, asset allocation, and risk management. Michael has over 25 years of financial markets experience. In this time he has managed $50 billion+ institutional portfolios as well as sub $1 million individual portfolios. Michael is a partner at Real Investment Advice and RIA Pro Contributing Editor and Research Director. Co-founder of 720 Global. You can follow Michael on Twitter .
What Is SteadyOptions?
Full Trading Plan
Complete Portfolio Approach
Diversified Options Strategies
Exclusive Community Forum
Steady And Consistent Gains
High Quality Education
Risk Management, Portfolio Size
Performance based on real fills
Non-directional Options Strategies
10-15 trade Ideas Per Month
Targets 5-7% Monthly Net Return
Recent Articles
Articles
Pricing Models and Volatility Problems
Most traders are aware of the volatility-related problem with the best-known option pricing model, Black-Scholes. The assumption under this model is that volatility remains constant over the entire remaining life of the option.
By Michael C. Thomsett, August 16

- Added byMichael C. Thomsett
- August 16
Option Arbitrage Risks
Options traders dealing in arbitrage might not appreciate the forms of risk they face. The typical arbitrage position is found in synthetic long or short stock. In these positions, the combined options act exactly like the underlying. This creates the arbitrage.
By Michael C. Thomsett, August 7
- Added byMichael C. Thomsett
- August 7
Why Haven't You Started Investing Yet?
You are probably aware that investment opportunities are great for building wealth. Whether you opt for stocks and shares, precious metals, forex trading, or something else besides, you could afford yourself financial freedom. But if you haven't dipped your toes into the world of investing yet, we have to ask ourselves why.
By Kim, August 7

- Added byKim
- August 7
Historical Drawdowns for Global Equity Portfolios
Globally diversified equity portfolios typically hold thousands of stocks across dozens of countries. This degree of diversification minimizes the risk of a single company, country, or sector. Because of this diversification, investors should be cautious about confusing temporary declines with permanent loss of capital like with single stocks.
By Jesse, August 6

- Added byJesse
- August 6
Types of Volatility
Are most options traders aware of five different types of volatility? Probably not. Most only deal with two types, historical and implied. All five types (historical, implied, future, forecast and seasonal), deserve some explanation and study.
By Michael C. Thomsett, August 1
- Added byMichael C. Thomsett
- August 1
The Performance Gap Between Large Growth and Small Value Stocks
Academic research suggests there are differences in expected returns among stocks over the long-term. Small companies with low fundamental valuations (Small Cap Value) have higher expected returns than big companies with high valuations (Large Cap Growth).
By Jesse, July 21
- Added byJesse
- July 21
How New Traders Can Use Trade Psychology To Succeed
People have been trying to figure out just what makes humans tick for hundreds of years. In some respects, we’ve come a long way, in others, we’ve barely scratched the surface. Like it or not, many industries take advantage of this knowledge to influence our behaviour and buying patterns.
- Added byKim
- July 21
A Reliable Reversal Signal
Options traders struggle constantly with the quest for reliable
By Michael C. Thomsett, July 20
- Added byMichael C. Thomsett
- July 20
Premium at Risk
Should options traders consider “premium at risk” when entering strategies? Most traders focus on calculated maximum profit or loss and breakeven price levels. But inefficiencies in option behavior, especially when close to expiration, make these basic calculations limited in value, and at times misleading.
By Michael C. Thomsett, July 13
- Added byMichael C. Thomsett
- July 13
Diversified Leveraged Anchor Performance
In our continued efforts to improve the Anchor strategy, in April of this year we began tracking a Diversified Leveraged Anchor strategy, under the theory that, over time, a diversified portfolio performs better than an undiversified portfolio in numerous metrics. Not only does overall performance tend to increase, but volatility and drawdowns tend to decrease: