
“ In fact, the crowd sees hardly anything out there that might end this market party.”
In the first 18 trading days of 2018, the S&P 500 set 14 record highs and amassed a generous 7.50% return for the year.
As quoted, CNBC and most other financial media outlets were exuberant over the prospects for further gains. Wall Street analysts fell right in line. Despite the fact it was not even February, some Wall Street banks were furiously revising their year-end S&P 500 forecasts higher.
On January 27 th , the S&P 500 closed down 0.70%, and in less than three weeks, the index fell over 10% from the January 26 th high. Very few investors harbored any concern that the rare down day on the 27 th was the first in a string of losses that would more than erase 2018’s gains to that point.
Looking back at the January swoon, there were a few indicators that CNBC, others in the media, and those on Wall Street failed to notice. In mid-January, we noticed an anomaly which proved to be a strong leading indicator of what was ultimately to transpire.The purpose of this article is tore-introduce you to this indicator,as it may once again prove helpful. We’ll also remind you why ignoring media and Wall Street driven hype is important.
VIX is the abbreviation for the Chicago Board of Options Exchange (CBOE) Volatility Index, which gauges the amount of implied volatility in the S&P 500 as measured by pricing in the equity options market.
When optimism runs high, investors tend toseek less downsideprotection and as such VIX tends to decline. Conversely, when markets are more fearful of the downside, VIX tends to rise as investors are willing to pay higher prices for protection via the options market. While not a hard and fast rule, VIX tends to be elevated in down markets and subdued in bullish markets. This historical relationship is shown below. The beigerectangleshighlight recent market drawdowns and the accompanying VIX spikes.
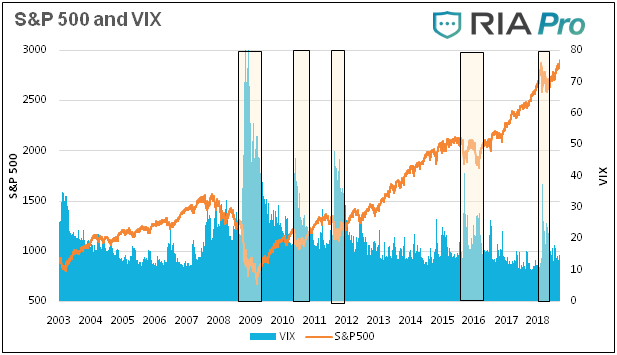
Data Courtesy Bloomberg
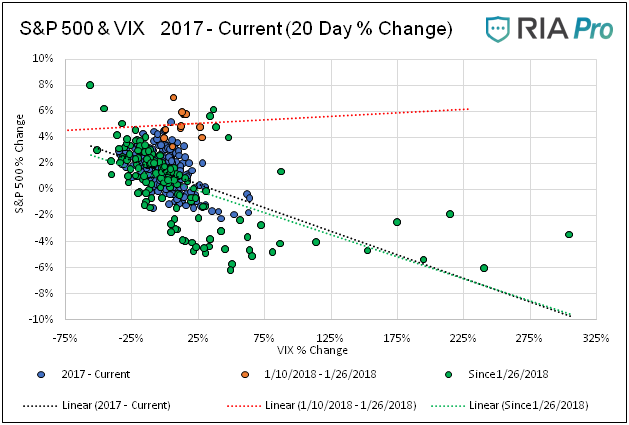
Another way to show the relationship is with a scatter plot. Each dot in the plot below represents the percentage change in VIX and the associated percentage change in the S&P 500 for the prior 20 days. The data goes back to 2003. While there are outliers, the graph generally illustrates an inverse relationship, whereby a higher VIX is associated with lower S&P returns and vice versa.
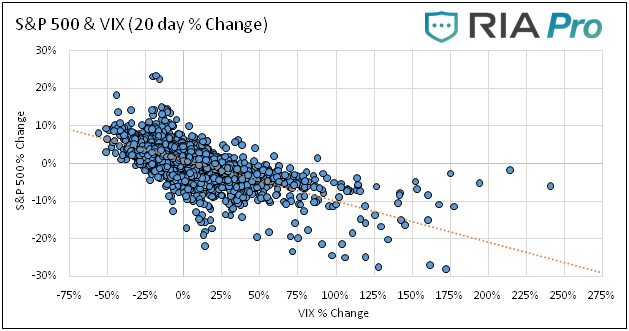
Data Courtesy Bloomberg
January 10th-26 th
With an understanding of volatility and its general relationship with marketdirection, we return to the 12 trading days leading up January 27th. The graph below charts the VIX index and the S&P 500 from January 1st to the 26 th .
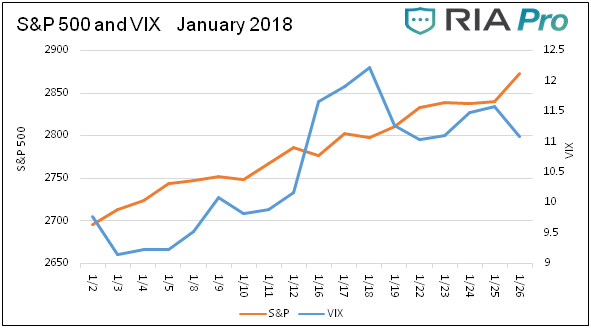
Data Courtesy Bloomberg
The obvious takeaway is that the VIX and the S&P rose in unison. Despite a euphoric financial media, daily record highs and a strong upward trend,investors were increasingly demanding insurance in the options markets.
The scatter plot and its trend lines below show this divergence from the norm.The orange dots represent the daily VIX and S&P changes from the 10 th to the 26 th while the blue dots represent every trading day from January 1, 2017, thru August 2018.
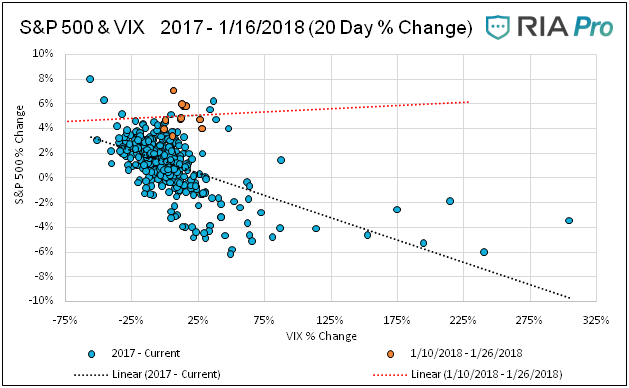
Data Courtesy Bloomberg
From January 27, 2018 to early March, the VIX was trading over 20, twice the general level that prevailed in early January and throughout most of 2017. The elevated VIX and weak market resulted in a normalization of the typical inverse relationship between volatility and equity performance, and it has stayed normal ever since. The green dots and green trend line in the graph below represent data since January 27 th . The divergence and normalization can best seen by comparing the trend lines of each respective period.
Data Courtesy Bloomberg
Tracking VIX
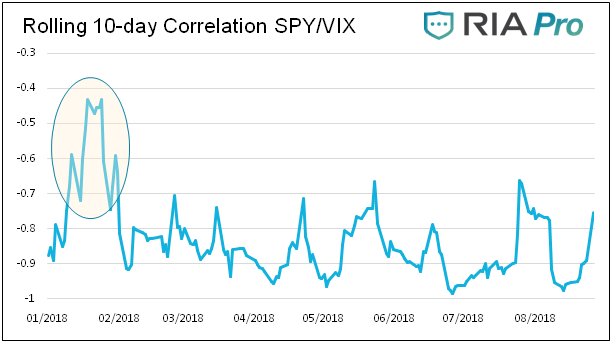
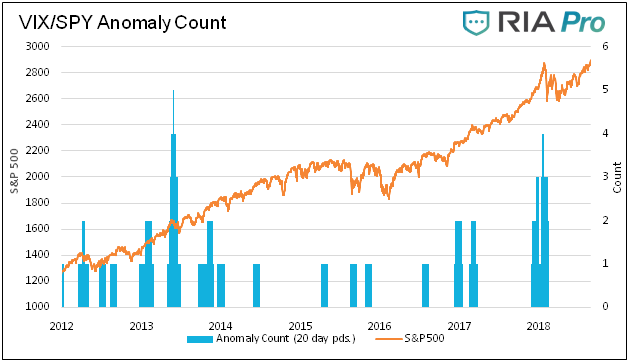
In addition to identifying the relationship as we did in January, we must monitor this relationship going forward. We show two additional metrics for VIX and S&P 500 below that we created to alert us if the typical inverse relationship changes.
- Running Correlation
- Anomaly Countand the VIX rose. In the second chart below,the blue bars represent the number of trading days out of the past 20 days when the S&P 500 rose by more than .50% and the VIX was higher.
Data Courtesy Bloomberg
Data Courtesy Bloomberg
Summary
Markets do not suddenly drop without providing hints. As we discussed in our article 1987 , the devastating Black Monday 22.60% rout was preceded by many clues that investors were unaware of or, more likely, simply chose to ignore.
Currently, most technical indicators are flashing bullish signals. Conversely, most measures of valuation point to the risk of a major drawdown. This stark contrast demands our attention and vigilance in looking for any data that can provide further guidance. The VIX is just one of many technical tools investors can use to look for signals. We have little doubt that, when this bull market finally succumbs to overvaluation and the burden of imposing levels of debt, clues will emerge that will help us anticipate those changes and manage risk appropriately.
Michael Lebowitz, CFA is an Investment Analyst and Portfolio Manager for Clarity Financial, LLC specializing in macroeconomic research, valuations, asset allocation, and risk management. Michael has over 25 years of financial markets experience. In this time he has managed $50 billion+ institutional portfolios as well as sub $1 million individual portfolios. Michael is a partner at Real Investment Advice and RIA Pro Contributing Editor and Research Director. Co-founder of 720 Global. You can follow Michael on Twitter .
What Is SteadyOptions?
Full Trading Plan
Complete Portfolio Approach
Diversified Options Strategies
Exclusive Community Forum
Steady And Consistent Gains
High Quality Education
Risk Management, Portfolio Size
Performance based on real fills
Non-directional Options Strategies
10-15 trade Ideas Per Month
Targets 5-7% Monthly Net Return
Recent Articles
Articles
Pricing Models and Volatility Problems
Most traders are aware of the volatility-related problem with the best-known option pricing model, Black-Scholes. The assumption under this model is that volatility remains constant over the entire remaining life of the option.
By Michael C. Thomsett, August 16

- Added byMichael C. Thomsett
- August 16
Option Arbitrage Risks
Options traders dealing in arbitrage might not appreciate the forms of risk they face. The typical arbitrage position is found in synthetic long or short stock. In these positions, the combined options act exactly like the underlying. This creates the arbitrage.
By Michael C. Thomsett, August 7
- Added byMichael C. Thomsett
- August 7
Why Haven't You Started Investing Yet?
You are probably aware that investment opportunities are great for building wealth. Whether you opt for stocks and shares, precious metals, forex trading, or something else besides, you could afford yourself financial freedom. But if you haven't dipped your toes into the world of investing yet, we have to ask ourselves why.
By Kim, August 7

- Added byKim
- August 7
Historical Drawdowns for Global Equity Portfolios
Globally diversified equity portfolios typically hold thousands of stocks across dozens of countries. This degree of diversification minimizes the risk of a single company, country, or sector. Because of this diversification, investors should be cautious about confusing temporary declines with permanent loss of capital like with single stocks.
By Jesse, August 6

- Added byJesse
- August 6
Types of Volatility
Are most options traders aware of five different types of volatility? Probably not. Most only deal with two types, historical and implied. All five types (historical, implied, future, forecast and seasonal), deserve some explanation and study.
By Michael C. Thomsett, August 1
- Added byMichael C. Thomsett
- August 1
The Performance Gap Between Large Growth and Small Value Stocks
Academic research suggests there are differences in expected returns among stocks over the long-term. Small companies with low fundamental valuations (Small Cap Value) have higher expected returns than big companies with high valuations (Large Cap Growth).
By Jesse, July 21
- Added byJesse
- July 21
How New Traders Can Use Trade Psychology To Succeed
People have been trying to figure out just what makes humans tick for hundreds of years. In some respects, we’ve come a long way, in others, we’ve barely scratched the surface. Like it or not, many industries take advantage of this knowledge to influence our behaviour and buying patterns.
- Added byKim
- July 21
A Reliable Reversal Signal
Options traders struggle constantly with the quest for reliable
By Michael C. Thomsett, July 20
- Added byMichael C. Thomsett
- July 20
Premium at Risk
Should options traders consider “premium at risk” when entering strategies? Most traders focus on calculated maximum profit or loss and breakeven price levels. But inefficiencies in option behavior, especially when close to expiration, make these basic calculations limited in value, and at times misleading.
By Michael C. Thomsett, July 13
- Added byMichael C. Thomsett
- July 13
Diversified Leveraged Anchor Performance
In our continued efforts to improve the Anchor strategy, in April of this year we began tracking a Diversified Leveraged Anchor strategy, under the theory that, over time, a diversified portfolio performs better than an undiversified portfolio in numerous metrics. Not only does overall performance tend to increase, but volatility and drawdowns tend to decrease: